eXpected Goals (xG) is a popular method of answering that age old question of which team ‘deserved’ to win a match. It does this by assigning a probability of a goal being scored from every opportunity based upon various metrics, such as the distance from goal, number of defenders nearby, and so on. By comparing a team’s actual standings with those from the output of an xG model we get a retrospective measure of how well a team is doing given their chances.
I’ve recently been looking at an alternative perspective of measuring overperformance, using prospective pre-match estimates. The difference is that if Man City lost to Huddersfield after only creating one weak scoring opportunity then a prospective approach would quantify it as an upset while xG would have it as expected.
I could use bookies’ odds for the pre-match forecasts as many people do, but I’ve updated my match prediction model to estimate scorelines and sense a fun application of it here. The model outputs a probability distribution of the goals scored by each team, which can be converted into a distibution of scorelines by substituting one from the other.
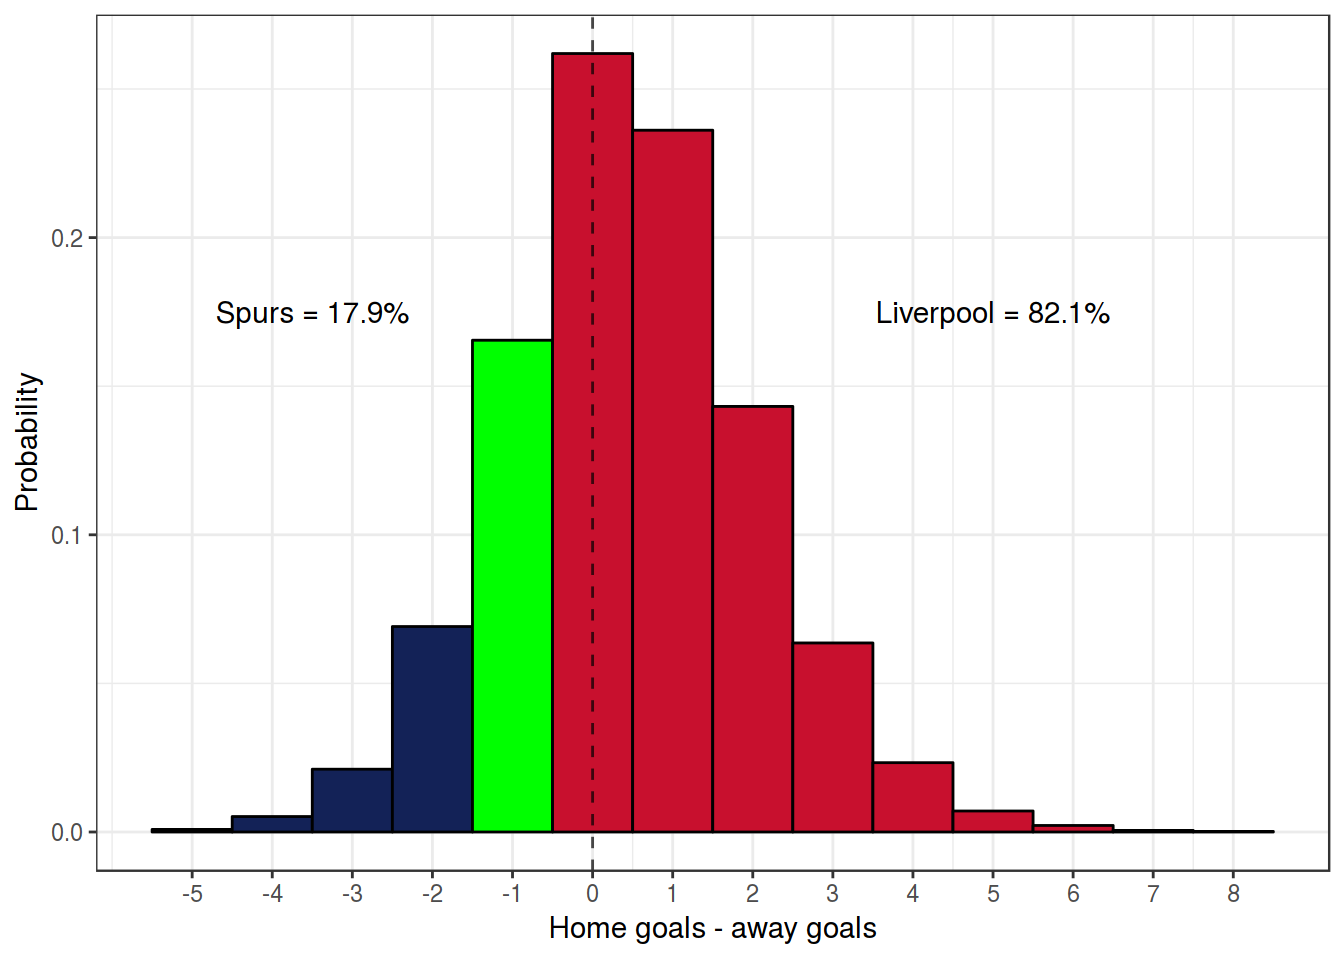
For example, let’s take the Tottenham vs Liverpool match from last Saturday. Before the game, Predictaball rated Spurs slightly more highly than Liverpool (1686 vs 1677 rating); with home advantage Spurs had a predicted win probability of 46.2%. The scoreline distribution for this match is shown below, observe how it is skewed towards positive outcomes. However, in the end Liverpool won by 1 goal (should have been more!), indicated by the green bar at *x* = − 1.
To quantify how much a team is over - or under - achieving, I calculate the probability of each team getting the current result or worse. A value of 50% means the team is doing as well as the median predicted outcome, anything higher is over-performing, and <50% is under-performing. I term this score potential and will illustrate it with an example. The probability of Liverpool doing worse than the result was 73% and the probability of Spurs doing worse was 10.4%. Half of the probability for the result (16.6% here) is then added to each team’s potential to provide a zero-sum statistic (i.e. the mean potential from a game is 50%).
Each team’s potential scores from this game are shown on the plot.

Using the scoreline provides more information on how well a team is doing than using outcome probabilities alone; a similar statistic using pre-match odds would give the same score if a team won 1-0 or 5-0. Starting from this season, potential is calculated after every game with each team’s current average displayed on Predictaball’s website under the Team ratings tab.
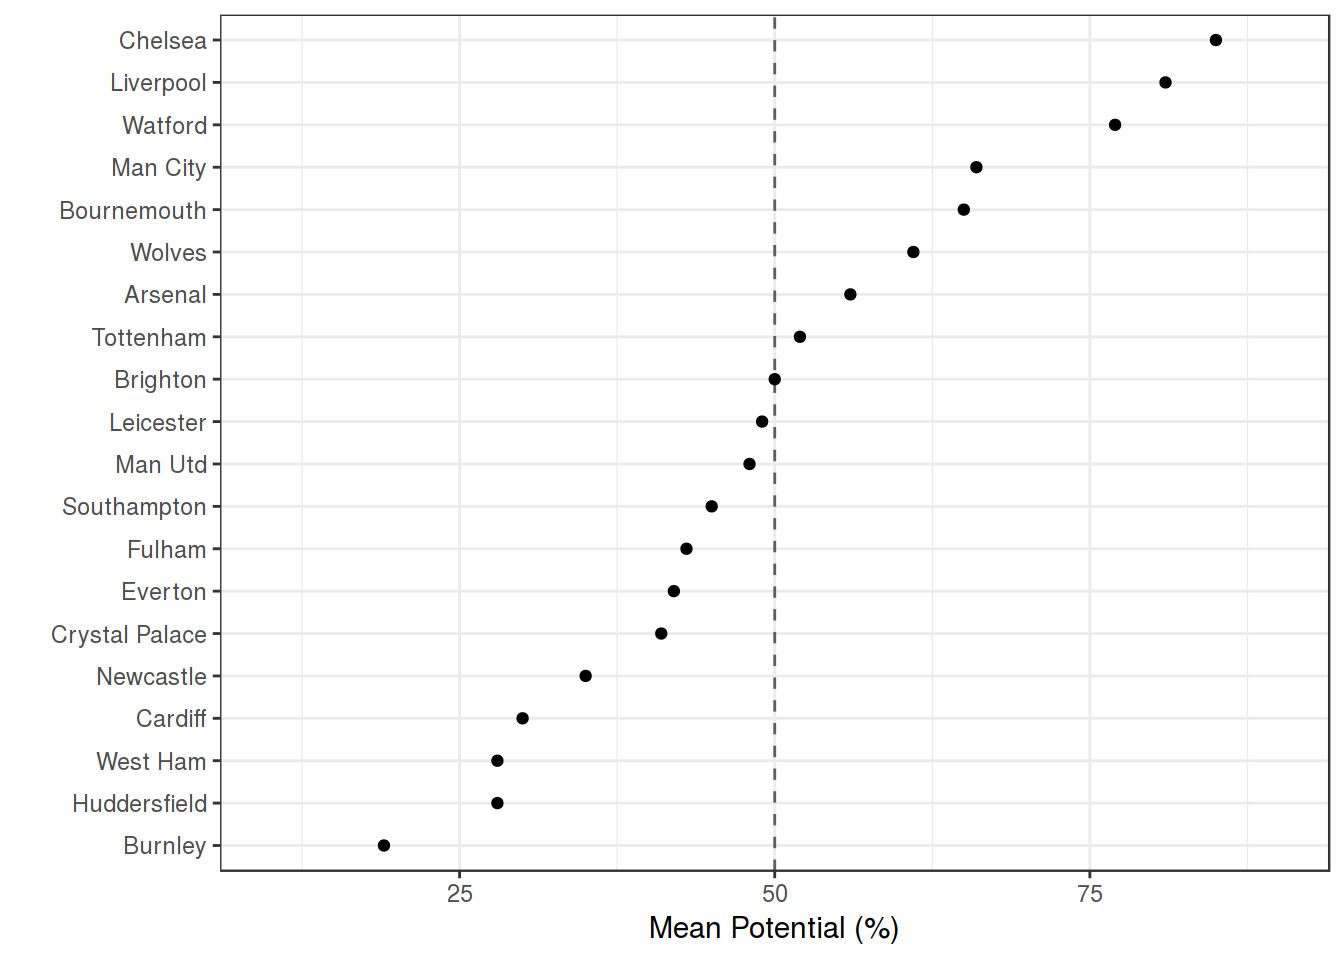
I’ve plotted the current (after matchweek 5) potential scores from the Premier League below. At this early point of the season there is a relatively large spread since the ratings haven’t stabilized yet following squad/staff transfers over the summer break. What’s interesting to note is that Watford have the 3rd highest potential despite losing to Man Utd at the weekend, demonstrating just how unlikely their first 4 game run was. At the other end of the scale, Burnley’s early season collapse is evident.

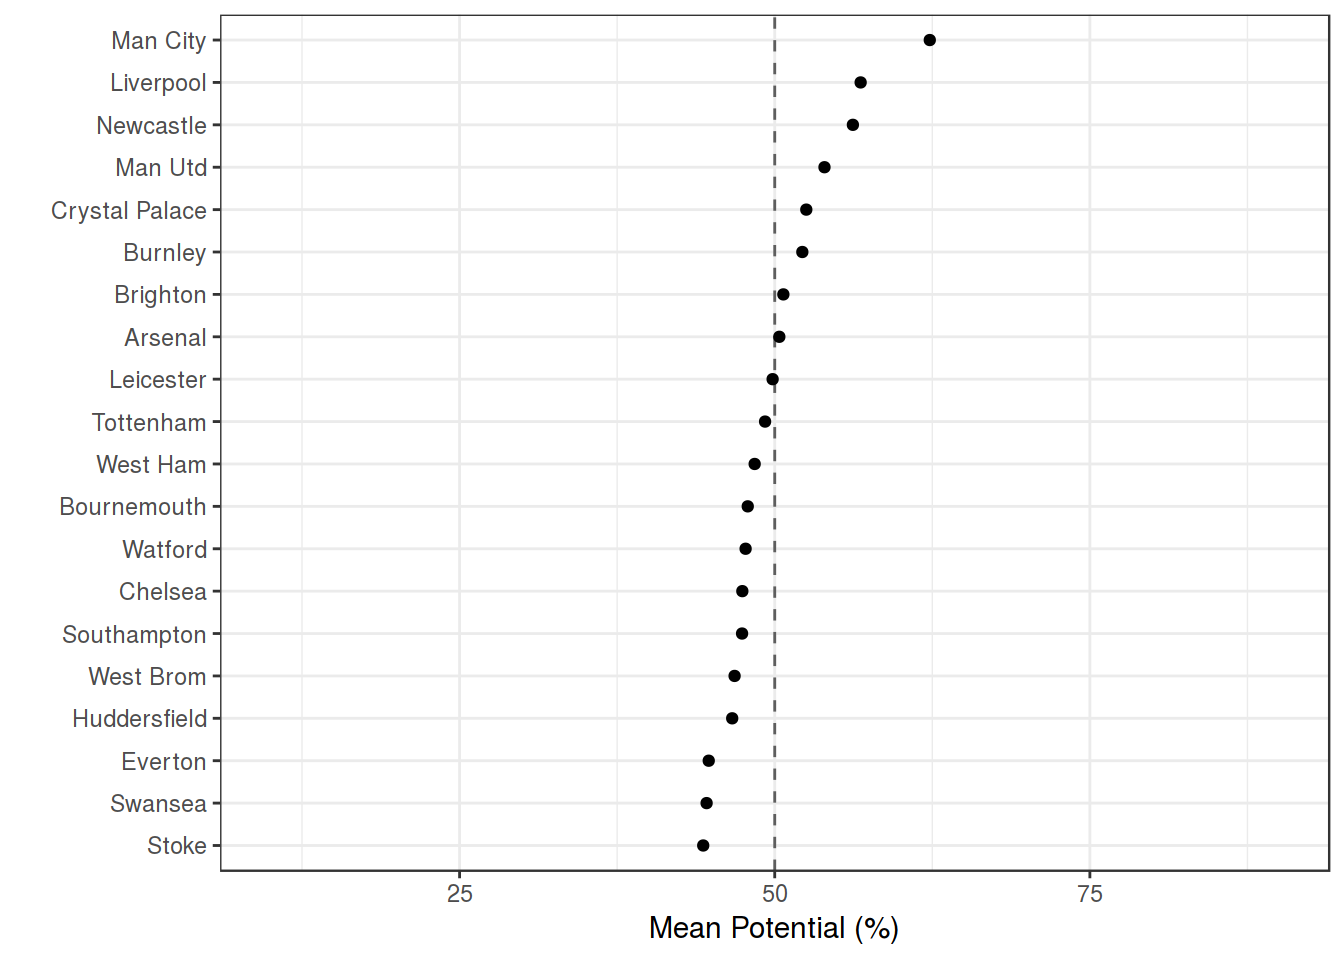
The plot below shows the average potential scores over last season which have a much narrower range due to the larger sample size. It highlights the magnitude of Newcastle’s achievement, having obtained the 3rd highest potential despite a meagre budget. This statistic can be used to place the actual standings in context; for example, Burnley and Everton finished in 7th and 8th respectively but while Burnley had the 6th highest potential, Everton were second from bottom with 44.8%. This suggests a significant difference in fortunes for each team that is masked by solely considering standings.

Simulating season endings
Now that the match prediction model outputs scorelines I can simulate multiple games in advance, even until the end of the season. This wasn’t possible before as the margin of victory is needed to update the ratings.
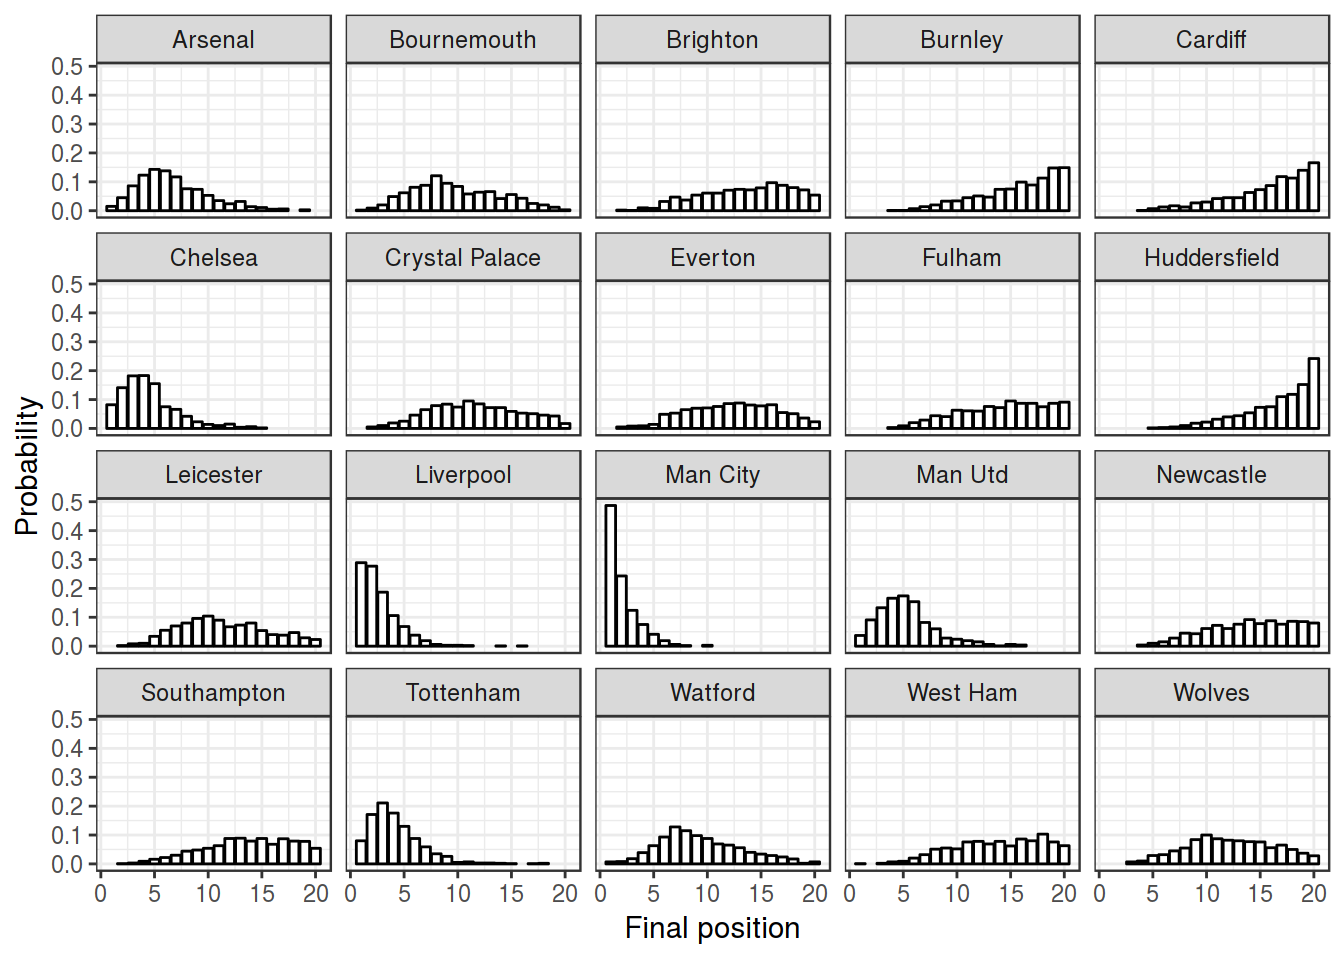
I simulated the remainder of this season’s fixtures playing out 1000 times and have plotted the distribution of each team’s final standing below. Right now there is a large amount of uncertainty as there are 33 remaining fixtures, but the distributions will get tighter as the season progresses. I’ve added the simulated season endings to the Predictaball website on the Team ratings tab where they are updated daily.
