Having become interested in football again due to the World Cup, I was thinking about Predictaball and how I never wrapped up the season with a brief review.
It’s been a big season for Predictaball, with the move to an Elo-based system, as well as the launch of a website. However, is the new match forecasting method any good?
Model accuracy
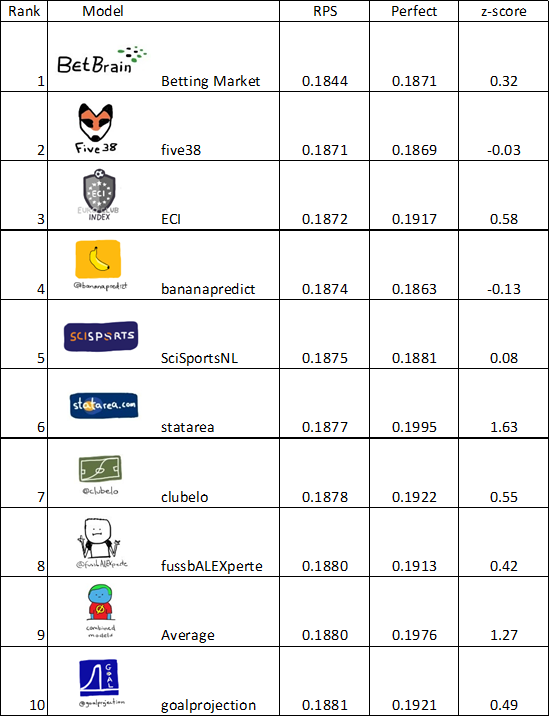
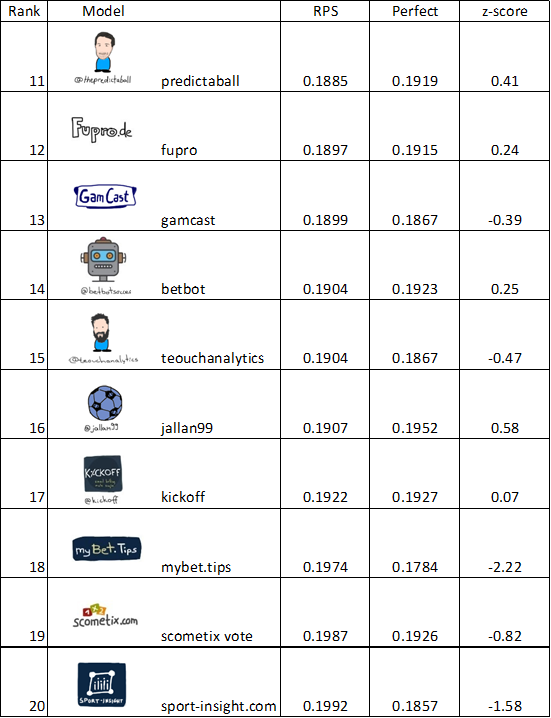
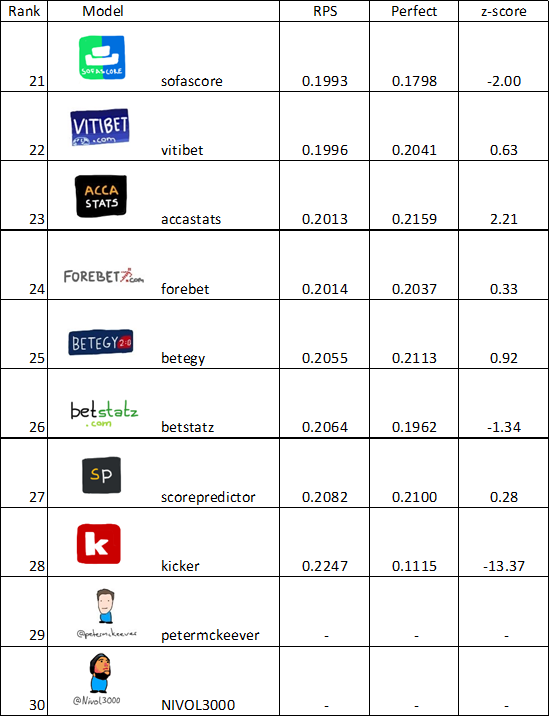
Fortunately, to help answer this question, a very generous Twitter user by the name of Alex B has been collecting weekly Premiership match predictions from around 30 models and tracked their progress. He’s uploaded the final ranking on his site, and I’ve also displayed them below (hotlinking images is bad mkay). Remember that a lower RPS score means more accurate predictions.
First of all, Predictaball comes in at 11th out of the 28 who have entered every week since week 9 (330 games). This is pretty good, especially considering how small the differences are between the top 10 - there is the same RPS difference between Predictaball in 11th and fupro in 12th as there is to the 4th ranked model. Furthermore, below this table is the standings as they were at the end of game week 36 with just 20 games to go, when Predictaball was in 6th. This suggests that the ordering of these competitors is very variable and small differences are due to chance rather than any significant difference between model accuracy. This is bad news for those wanting to make a quick buck, but it’s not surprising - if it were that easy to make money then the bookies wouldn’t be in business.
If anything, the main trend is that the you can’t beat the bookies, as the betting market model - BetBrain - consistently comes out on top.
These are the standings after game week 36.
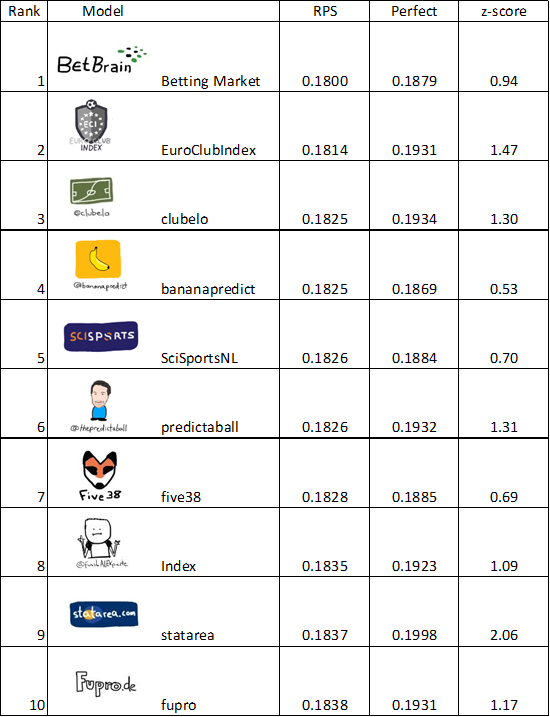
I said before that any differences between these models is likely due to chance, but there is another factor: model complexity. I don’t know much about many of the top ten, but I know that 538 include a variety of match statistics in their rating system, including adjusted and expected goals, and also model each team’s strength in terms of both an offensive and defensive rating (see their website for more details). They also have formulated a global rating, enabling forecasts for the Champions League and other inter-league competitions.
This use of more detailed match statistics could be a reason why Predictaball is further down the rankings than I’d expect, although given that it was in 6th with only 2 weeks to go I imagine it was more due to chance.
This discrepancy highlights the challenge with evaluating predictive models on what is essentially a very noisy problem with a reasonably small sample size. If the point in time at which we assess the models makes a big difference to the results then we should be careful to not read too much into these results - a trap I tend to fall into.
Comparison to other leagues
I’ve also displayed the RPS scores for the other 3 major European leagues below. Firstly note that the Premier League score is different to the one from Alex B’s comparison, this is because he started collecting data at game week 9, whereas the value below is across every game week, including the initial ones where team ratings are unstable due to strength changes from summer transfers.
Secondly, we can see that there does appear to be a noticeable difference in predictive accuracy between these leagues, at least a far higher difference than between the different rating systems above. I’m not surprised to see the Bundesliga having the highest RPS as it is often said to be the most competitive of the 4 leagues.
| League | RPS |
|---|---|
| Serie A | 0.1899 |
| Premier League | 0.1904 |
| La Liga | 0.2019 |
| Bundesliga | 0.2072 |
Team ratings
Let’s have a quick look at the actual team ratings themselves, which are all fully available and with nice interactive plots at thepredictaball.com.
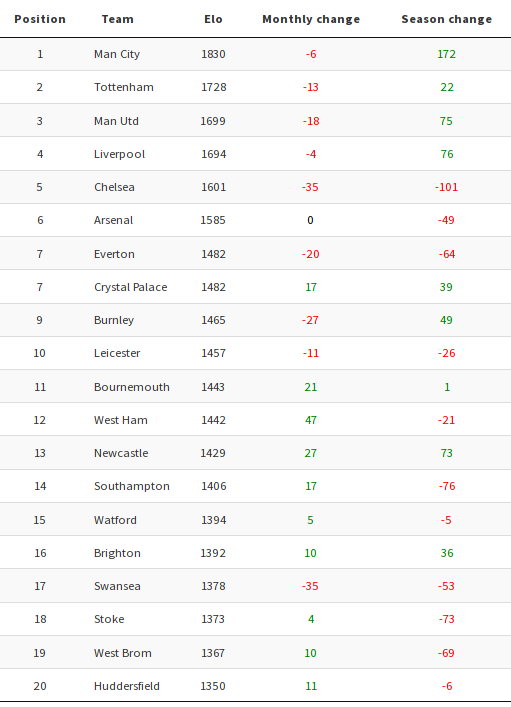
Man City’s brilliant season is highlighted by their Elo increase of a whopping 172 points, in the process reaching the highest Premiership rating since I started recording it in 2005-2006 with 1836 at the end of April.
On the other hand Chelsea’s poor season is demonstrated by losing 101 rating points since August. Newcastle did the best of the promoted teams by far, gaining 73 points taking them to 13th in standings (10th in the actual league). I’m unsure why Huddersfield have the overall lowest Elo despite finishing 16th. This could be an artefact of not tracking Championship teams and just assigning them the average rating of the relegated teams they are replacing when promoted to the Premiership. Otherwise, as we’d expect, the 3 teams newly relegatd teams fill out the bottom 4.
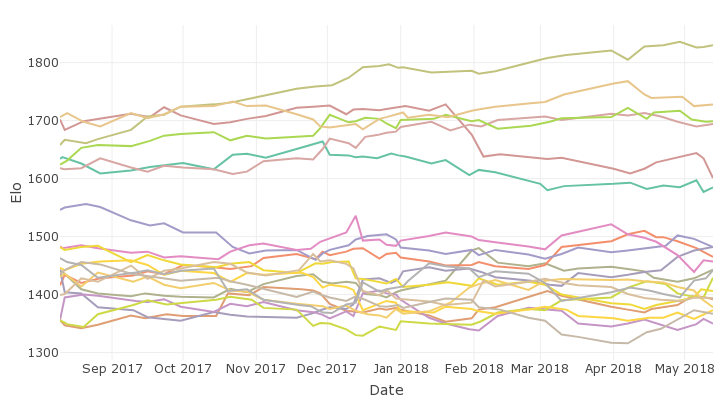
I’ve also plotted the ratings over time below, again taken from the Predictaball website (where they are more accessible as you can hover over each line to see the team name). Aside from Man City’s unstoppable rise we can see several trends, including: Chelsea’s demise around mid-January (darkish purple team that end up 5th); the tight grouping of Tottenham, Man Utd, and Liverpool from 2nd to 4th; and Arsenal’s very average season in light blue in 6th.
The gap to the remaining 14 teams is rather stark and highlights the uneven playing-field (pun intended) that exists in the Premier league..
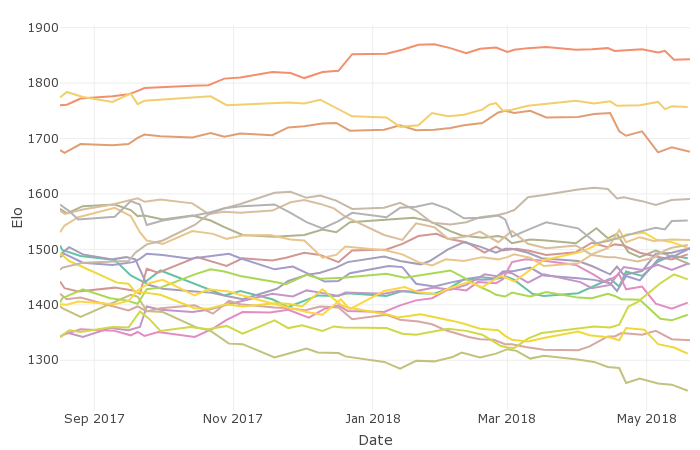
I’m not going to discuss every league here, but I thought the equivalent plot from La Liga is quite eye-catching and shows that it suffers from an even greater element of imbalance, with only 3 teams possibly having the ability required to win the league. However, Valencia (grey in 4th) have made a strong effort, with the second highest Elo improvement (128) helping them to break away from Sevilla and Villarreal, and this is reflected in the league standings too where they had a comfortable 12 point lead over 5th place.
The highest Elo gain was achieved by Getafe (132), who are hard to see but are the newly promoted purple team and so are in the group of the 3 teams with the lowest Elo in September. They ended up 13th by Elo, which is impressive enough but in the actual league standings they finished an incredible 8th.
And of course we have to discuss the top 2. Real Madrid’s (light orange) season started off well but after only a month or so the gap started to increase between them and Barcelona and this trend remained throughout the rest of the season, which Barcelona won at a jog. Atletico (brown in third) haven’t managed to really challenge Barcelona either, but have done remarkably well to keep within the top 3 in terms of rating, and despite having a lower rating than Madrid they managed to pip them to second place in the league.
2018-2019 season
As ever there’s always a list of new features I’d like to add over the summer. For example, a model that predicts the number of goals scored would be very useful as it’d allow me to multiple matches (and even seasons) in advance. I’d like to look into ways of having a global rating scale, so that Champions League matches can be forecast. I’ve also got a few ideas of improving the rating system by designing a new one specifically for football, rather than adapting the Elo method, but I won’t say much else on that until I get it implemented.
Finally, I’d like to update the website. It’s currently built using Shiny, a web-app framework written in R, which was chosen simply because I was already familiar with it and I do all my analysis in R anyway. However, it is rather slow and much less flexible than more ‘standard’ frameworks, principally because it’s specifically designed for building interactive dashboards for data analysis rather than providing a general one-size-fits-all solution.