In the last couple of months I’ve been teaching myself about multi-state survival models for use in an upcoming project. While I found the theoretical concepts relatively straight forward, I started having issues when I began to start implementing the models in software. There are many considerations to be made when building a multi-state model, such as:
- Convert the data into a suitable long format
- Deciding whether to use either parametric or semi-parametric models
- Different subsets of the available covariates can be selected for each of the transition hazards
- In addition, covariates can be forced to have the same hazard ratio on every transition
- There’s a choice to be made between clock-forward or clock-reset (semi-Markov models) time-scales
- The Markov assumption can be further violated by including the state arrival times as part of the transition hazard; this often has theoretical justification
- The baseline hazards can be kept stratified by transition, or certain ones can be assumed to be proportional
Needless to say, actually building a model was very time consuming. While I knew in my head what model for the transition hazards I wanted to use, I found the actual software implementation in R - in particular the mstate and flexsurv packages - wasn’t very intuitive. I realised I was spending more time trying to figure how to implement a state-arrival time covariate for a transition, for example, than actually thinking about the model at a higher level.
To help address this, I developed an interactive web app to abstract the software implementation details away so that the model builder can instead focus on the models themselves.
The app takes you through the process of building a multi-state model, abstracting the somewhat intimdating syntax of both mstate and flexsurv, allowing for semi and fully parametric models to be built without having to write any R code. The app allows for control of a number of settings, such as whether to use a clock-forward or clock-reset model, and whether to include time-since-entry in any transitions. Transition-specific covariate and baseline hazards can be fitted, or they can be grouped together. All these options are available in both mstate and flexsurv, but the manner in which they are implemented depends on the package and can be somewhat overwhelming for a novice user.
Because I’m unimaginative, I named this app MSM-Shiny. While I initially developed this app for myself to streamline my model building and data exploration pipeline, I realised it could benefit others and so developed it into a fully configurable app. I debuted it at the 6th Survival Analysis for Junior Researchers conference this past week in Leicester, where my presentation received the Best Presentation award.
The first step in the app is to specify the state structure. A long CSV date file is input into the app, with state entry time and censoring indicators provided in a specific format. From this, the app determines the state names, with the user selecting possible transitions from drop-down menu items.

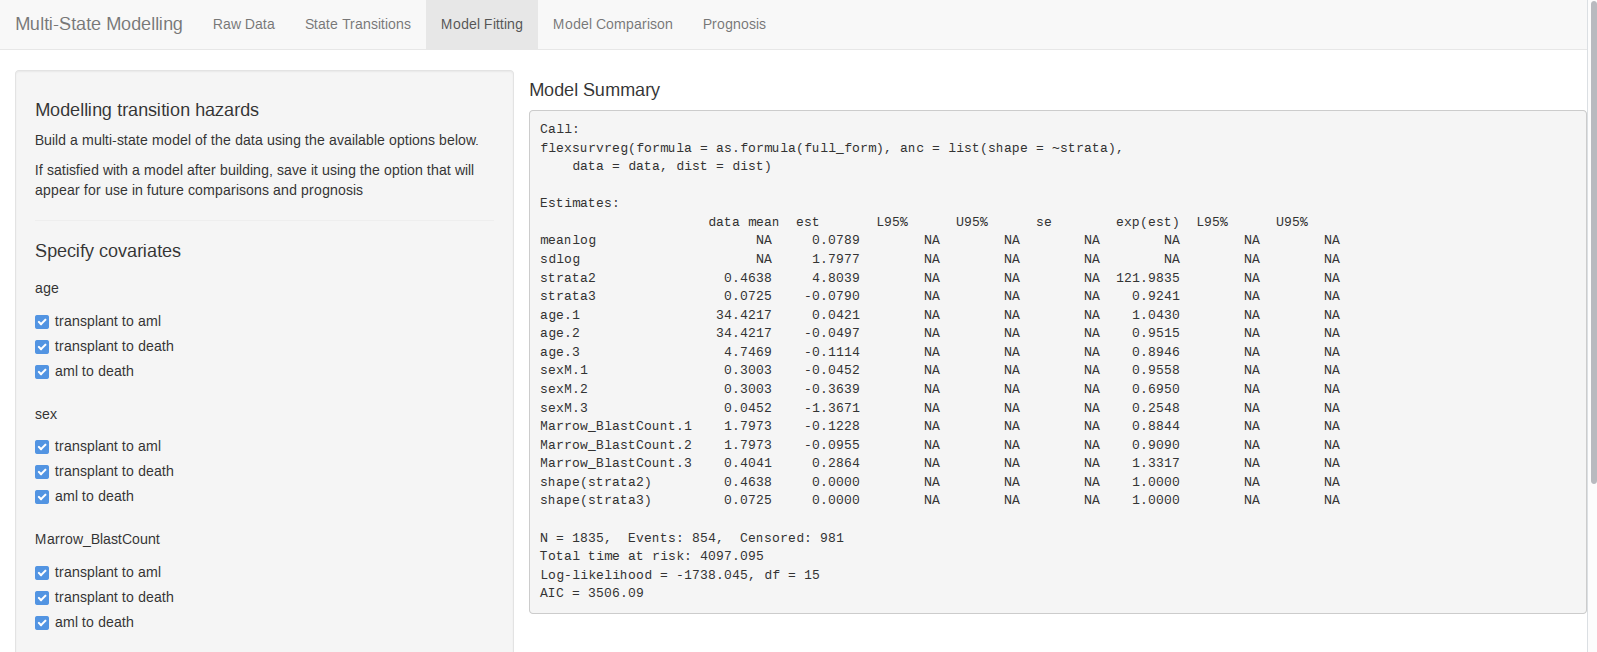
Next, a model can be built by slecting various options on the left pane (the pane scrolls down further), including which covariates impact on which transitions, whether baseline hazards proportional, whether to use a clock-forward or clock-reset model, and whether to incorporate time-since-entry in any intermediary states. A number of parametric distributions can be used, as well as a standard Cox proportional hazards regression.

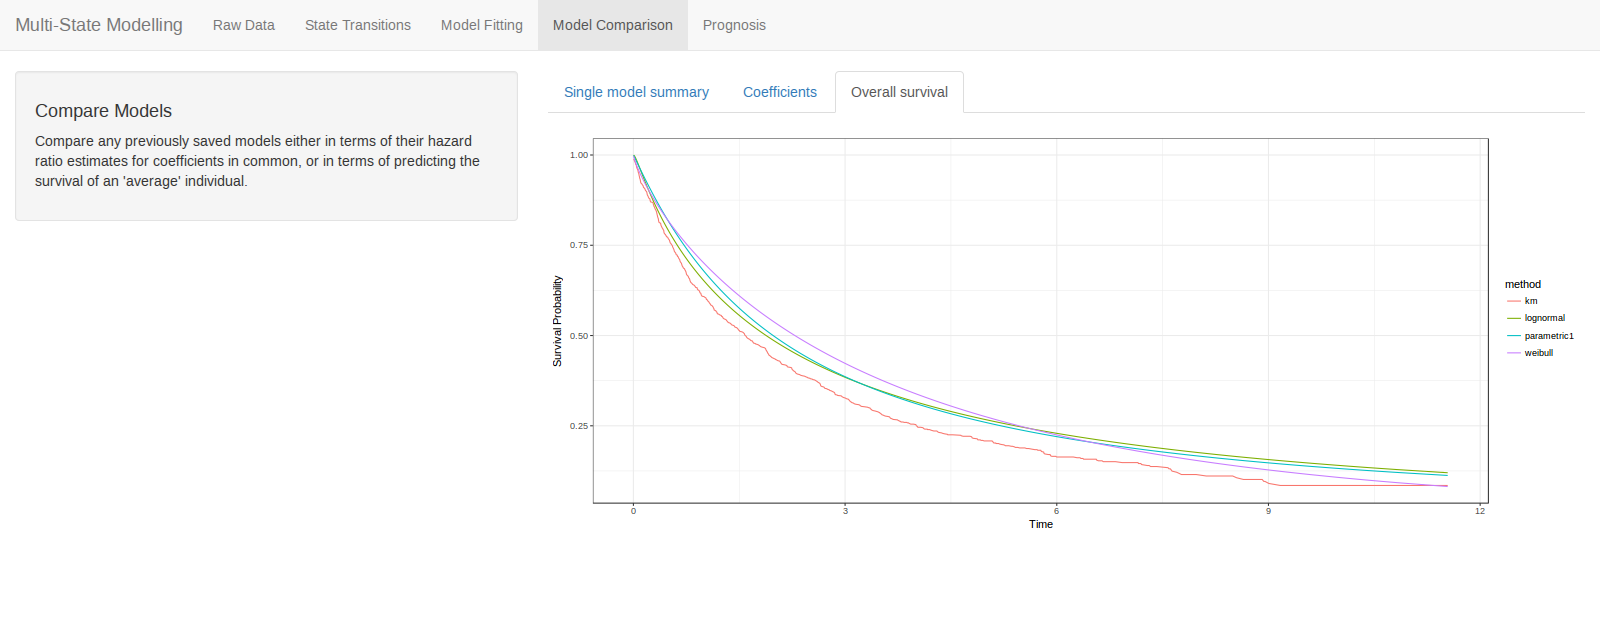
Each model that is fitted can be saved and compared, in terms of their coefficients, as well as their predicted survival curve for an example individual.

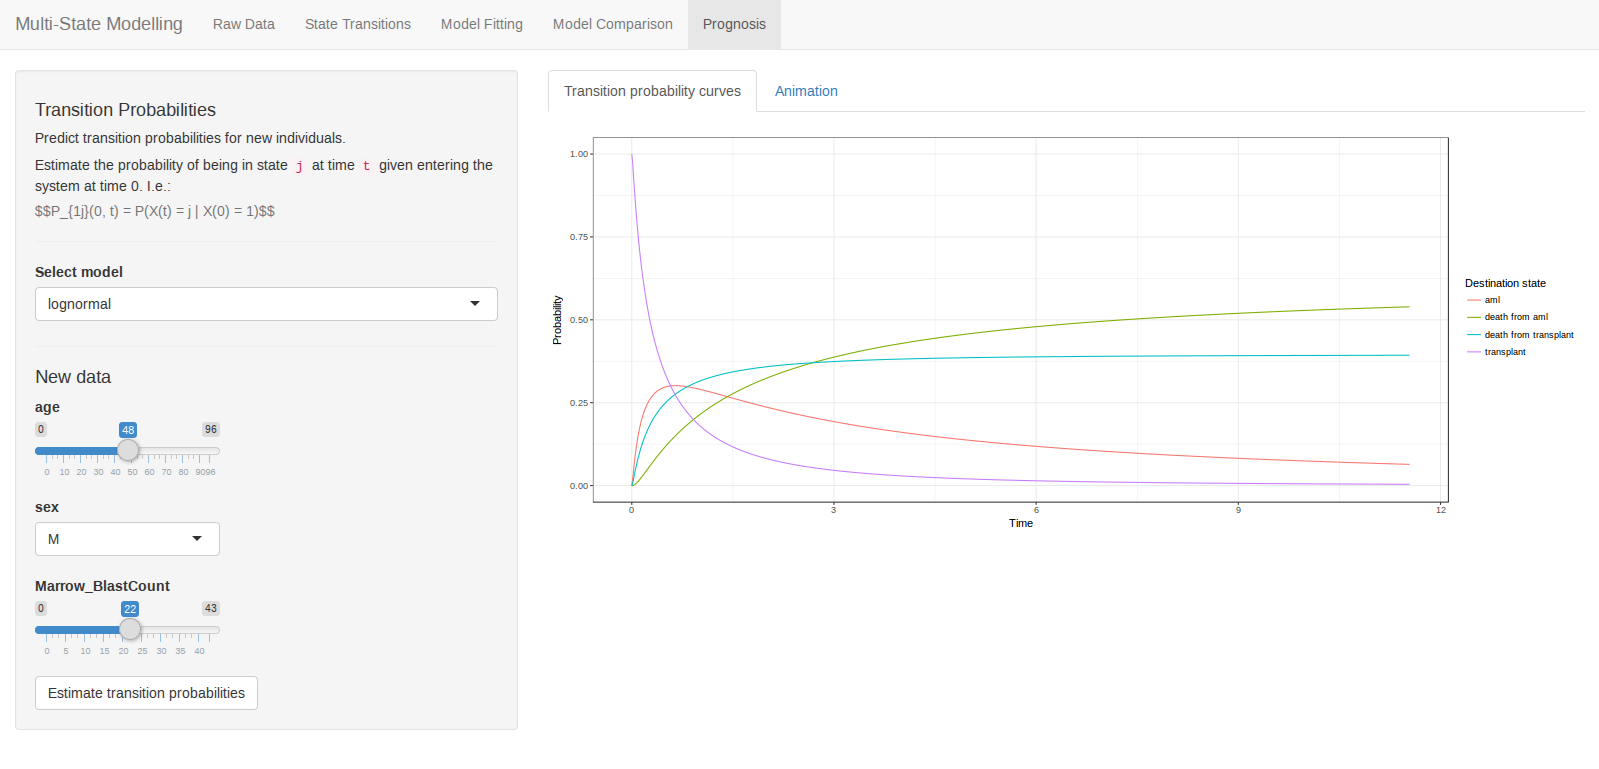
Finally, state occupancy probabilities can be estimated for specified individuals. These are conveyed both graphically, and in the form of an animation.

The app is available on ShinyApps.io and the code is freely available on my Github page; I’d love to hear any feedback.